7 questions to ask before you believe an A/B test
The deck says +23%, "98% confident", ship it. You didn't run the test and you can't re-derive the math in the meeting. You don't have to. A test that was run honestly survives seven short questions, and a test that wasn't starts wobbling on the second one. Here they are, with what good and bad answers sound like.
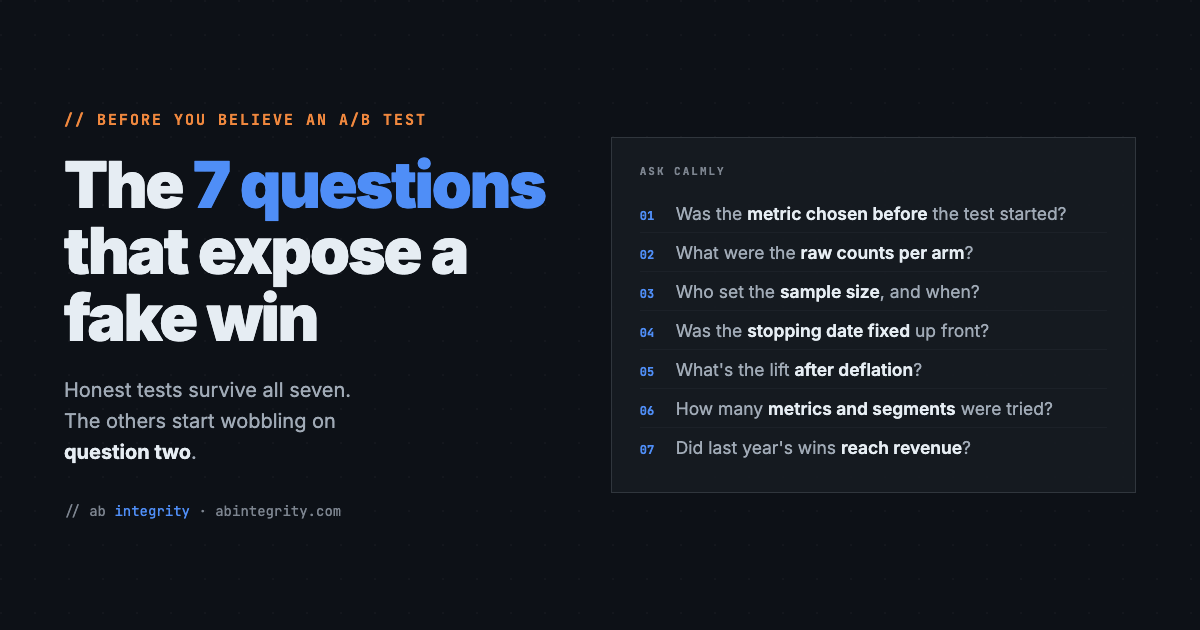
None of this requires statistics. Every question below is about process, and process is exactly what a presenter controls. The pattern to watch for is simple: honest testers answer instantly, because they decided these things before the test started. Evasive answers mean the decisions were made after the data came in, and that is where fake winners come from.
01Was this metric chosen before the test started?
A test is only valid for the question it was designed to answer. If the plan said "conversion rate" and the slide celebrates "revenue per visitor", someone went shopping after the results arrived. Measure enough numbers and one of them will clear the bar by luck alone. If the headline metric was picked after the data came in, the significance on the slide means nothing.
A written plan from before launch is called pre-registration. Lockbox exists so a team can produce one in five minutes.
02What were the raw visitor counts per arm?
The platform promised a 50/50 split. Ask for the actual numbers. On tens of thousands of visitors, even 51/49 can be statistically impossible by chance, and it means the assignment itself was broken: bots counted on one side, a redirect dropping people on the other. Every number downstream inherits the break. A test with a broken split is not a weaker result. It is no result.
SRM stands for sample ratio mismatch. Paste the two counts into the Platform Validator and it does the check in seconds.
03How many visitors did the test need, and who decided that before launch?
Every test needs a minimum amount of traffic to detect the effect it's hunting, decided up front. A test sized by the calendar is almost always undersized, and undersized tests have a nasty property: the only way they reach significance is by getting lucky, so their winners are inflated. "Two weeks, like always" is a schedule. A schedule is not a sample size.
04Was the stopping date fixed, or did the test end when it looked good?
Results wobble day to day. Check the dashboard every morning and stop the moment it flashes green, and you will catch a lucky peak. Done routinely, this quietly turns a 5% false-alarm rate into roughly one fake winner in four. Ending a test on its best day manufactures winners out of noise.
05What does the lift look like after deflation?
Tests that barely clear the significance bar overstate their effect, often by double. This is the winner's curse: when a modest true effect passes a noisy test, it passed because noise flattered it. The +23% on the slide is the flattered version. The smaller the test, the more the announced number exaggerates reality.
You can run this one yourself in two minutes: put the deck's four numbers into Reality Check and read the honest estimate.
06How many metrics and segments were examined?
Twenty metrics at 95% confidence means one false winner is the expected outcome, not the unlucky one. The same goes for segments. A win that only exists for "mobile users, returning, DE market" was usually found by slicing until something turned green. A win discovered in the eleventh segment is a coincidence with a slide deck.
07Did last year's wins show up in revenue?
The program-level question, and the one that ends careers of fake winners. Add up every lift announced over the past year and compare it with what the revenue line actually did. If the claims total +40% and revenue moved +4%, the testing program produces announcements. Wins that never reach the P&L were never wins.
The Program Ledger does this reconciliation from numbers you already have.
Download the seven questions as a one-page PDF → Print it, or keep it open during the readout.
Seven free tools for honest ecommerce experimentation: platform validation, pre-registration & sample size, survival analysis, winner deflation, integrity receipts, the program ledger, and subscription valuation. All of it runs in your browser. Explore the stack →