How much traffic do you need to A/B test an online store?
Some version of this question shows up every week on r/shopify, r/CRO, and r/ecommerce: "My store does about 10,000 visitors a month. Everyone says test everything, but my tests never reach significance. Am I doing something wrong?" No. The math was against you before you started.
Nobody selling testing tools has much incentive to answer this question honestly, because the honest answer is that below a certain traffic level, most of what the industry calls A/B testing cannot work. Not "works less well". Cannot work, in the sense that the test will not be able to tell a real winner from noise within any reasonable timeframe. The good news is that you can compute exactly where that line sits for your store in about two minutes, and there are useful moves left on the other side of it.
01Run the arithmetic before the test
How long a test needs depends on four numbers: your baseline conversion rate, the smallest lift you'd care about detecting, and your tolerance for false positives and misses (the standard choices are 95% confidence and 80% power). Plug in a typical small store: 2.5% conversion, 10,000 visitors a month, split across two versions. This is what comes out.
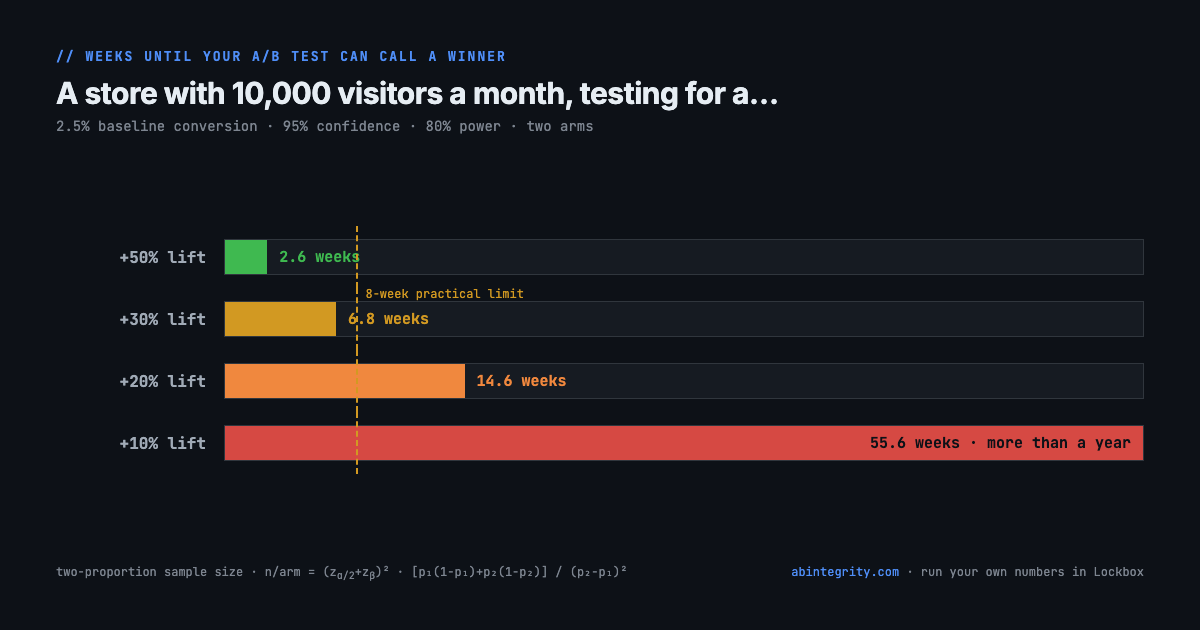
To reliably detect a +10% lift, which is a good outcome for a typical page tweak, you need about 128,000 visitors. At this store's traffic, that is 56 weeks. A year of frozen roadmap for one test. A +20% lift needs almost 15 weeks. Only somewhere past +30% does the timeline drop under eight weeks, which is roughly the longest most practitioners let a test run before cookie churn and seasonal drift start polluting the sample.
You can also flip the question around: to catch a +10% winner inside a single month, you need about 140,000 visitors a month. Detecting small effects is a big-store luxury. That sentence should be printed on the box of every testing tool, and it never is.
02"Just run it anyway" is worse than not testing
The tempting move at low traffic is to run the test anyway and hope. Sometimes p dips under .05 and it feels like beating the odds. What actually happened is less cheerful. When a test with 20 or 30% power comes back significant, it almost had to get lucky to clear the bar, so the measured lift is inflated, routinely by a factor of two or three. This is the winner's curse, and it means the +14% you're about to announce is probably a +5% in disguise. You ship it, the baseline doesn't move, and six months later someone in finance starts asking why none of the wins show up anywhere.
An underpowered test that "wins" is worse than no test, because it converts a guess into false certainty. If you have one of these marginal winners on your hands right now, Reality Check will deflate it to an honest estimate before you announce anything you'll have to defend later.
03Doesn't switching to Bayesian fix this?
It's the obvious objection, and worth taking seriously, because most of the tools people admire have already switched. Dynamic Yield runs on a Bayesian engine and reports a "probability to be best" instead of a p-value. VWO's SmartStats is Bayesian too. So if the industry leaders moved, maybe the frequentist math above is just the wrong tool, and a small store can test fine once it drops p-values.
Here is the part the vendor pages skip. Bayesian and frequentist statistics are two ways of reading the same data, and the data is where the information lives. If 10,000 visitors and 250 conversions can't separate a 10% lift from noise, no choice of statistical philosophy invents the missing signal. Feed that thin sample into a Bayesian model and you get a wide posterior: "probability B is better, 66%." That is not a green light. It is an honest way of writing "close to a coin flip". The arithmetic from the chart doesn't vanish when you change notation. It gets reported in a different unit.
So why did serious teams adopt it? Three reasons, and none of them is "it needs less traffic":
- It gives you a decision, not a verdict. A frequentist test hands a small store a binary "not significant", which reads as failure. Bayesian output is a probability paired with an expected loss: "72% chance B wins, and if we're wrong it costs about 0.2% of conversion". You can act on that with the traffic you have, as long as you treat 72% as 72% and not as a win.
- The prior is the winner's-curse fix, built in. Point a Bayesian model at a skeptical prior, one that starts from "most changes do nothing", and it automatically pulls a wild observed lift back toward zero. That's the same shrinkage the last section asked for, done in one step instead of bolted on after.
- It reads like a business answer. "92% to win, worst case costs this much" maps to a decision a merchant can defend in a meeting. A p-value of 0.04 gets misread in almost every meeting it appears in.
Two cautions before you treat Bayesian as an escape hatch. First, it does not make peeking free. Ship the moment "probability to be best" crosses 95% and you inflate your error rate the same way early frequentist stopping does. The expected-loss framing limits the damage, it doesn't remove it. Second, the paradigm split isn't even the real divide. Optimizely's Stats Engine solved the peeking problem while staying frequentist, using sequential always-valid p-values. "Bayesian versus frequentist" is not the axis that decides whether a small store can test. Sample size is.
The honest takeaway is narrower. Bayesian methods are better suited to deciding under the uncertainty a small store lives with, because they hand you a calibrated bet instead of a pass/fail stamp. They change what you do with a thin result. They do not thicken it. That's exactly why the honest-estimate tool in this stack, Reality Check, is Bayesian: give it your observed lift and a skeptical prior, and it returns the probability B truly beats A, plus a credible interval you can explain to anyone.
04What actually works at 10,000 visitors a month
The line in the chart isn't fixed. Each of these moves it in your favour, and none of them requires more traffic.
- Test bigger swings. Small stores earn their significance by testing things that can plausibly move conversion 30% or more: the offer itself, pricing presentation, bundling, a rebuilt product page. Button colours are for stores with a million visitors.
- Move the metric upstream. Add-to-cart fires several times more often than purchase. More events means smaller required samples, often cutting the timeline by two thirds. The trade-off is that it's a proxy, so write that down as part of the plan rather than deciding after the fact.
- Pool your templates. One test across every product page reaches significance where fifty per-page tests never would.
- Two arms, never five. Every extra variant splits your traffic and multiplies your false-positive risk at the same time.
05Do the two minutes of paperwork
All of the above only pays off if it's decided before the test starts. Lockbox has the sample size calculator built in and locks your metric, sample size, and stopping rule up front, so the temptation to peek daily or to quietly switch goals mid-test has nowhere to go. When a winner ships, log it in the Program Ledger next to your actual monthly numbers. That's how you find out whether your testing program produces revenue or just announcements.
The whole workflow is free and runs in your browser. Nothing gets uploaded, so you can put real client numbers in without asking anyone. Start with the calculator: two minutes of arithmetic before the test beats three months of arguing after it.
Seven free tools for honest ecommerce experimentation: platform validation, pre-registration & sample size, survival analysis, winner deflation, integrity receipts, the program ledger, and subscription valuation. All of it runs in your browser. Explore the stack →